
The Dashboard Overview is the central hub of License Optimizer. It provides a real-time summary of your Atlassian organization, helping administrators monitor user activity, track license consumption, and quickly identify opportunities for optimization.
Organization Health at a Glance
-
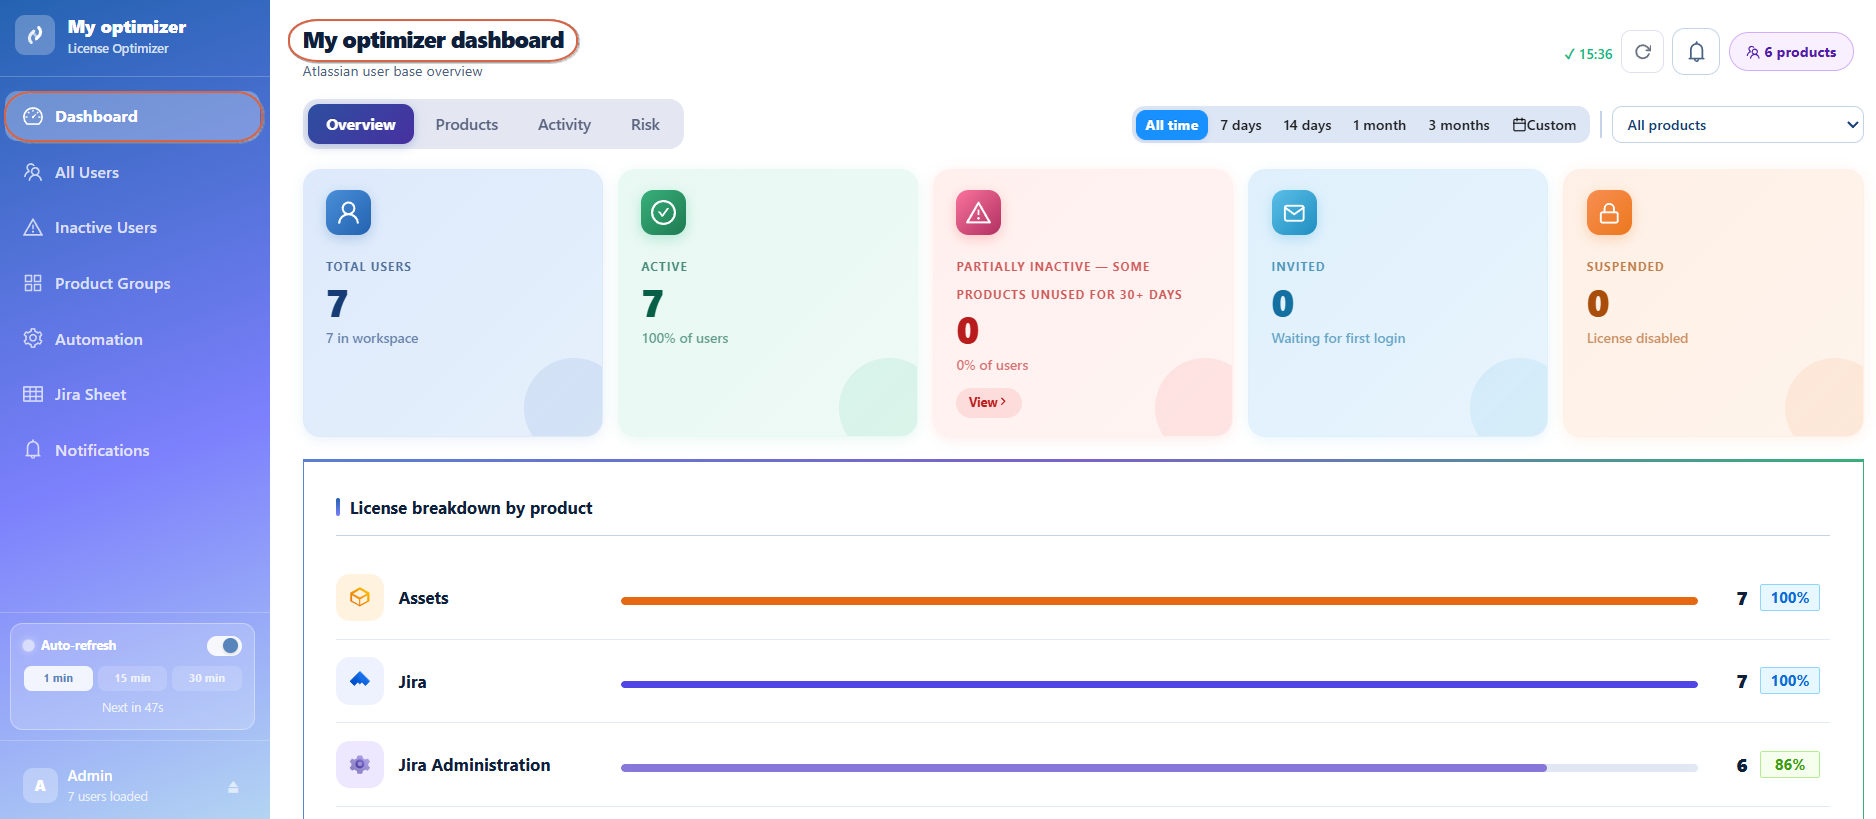
The top section of the dashboard presents key metrics about your organization
Total Users: Displays the total number of users within the organization.
Active Users : Shows users who are actively using Atlassian products and consuming licenses.
Partially Inactive Users : Highlights users who have not accessed one or more assigned products for an extended period.
Invited Users : Lists users who have been invited but have not yet logged in.
Suspended Users : Displays users whose access has been disabled and who no longer consume product licenses.
These indicators provide an immediate understanding of the overall health and utilization of your Atlassian environment.
Wasted License Estimation: Provides an estimate of licenses that may be unnecessarily allocated to inactive or never-active users.
This indicator helps administrators quickly identify potential cost-saving opportunities and take action to reclaim unused licenses before renewal periods.
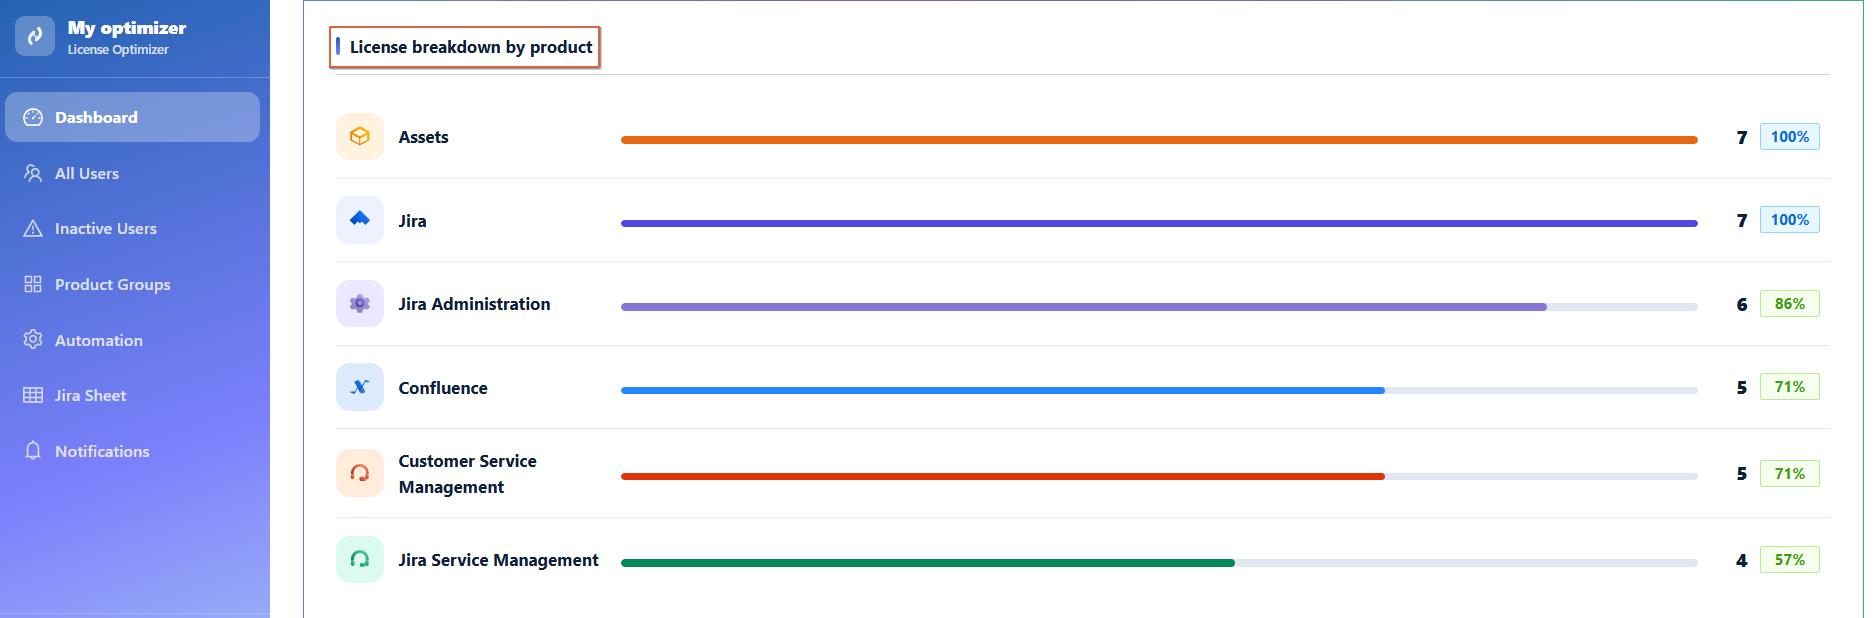
License Distribution Across Products
The License Breakdown section shows how licenses are distributed across Atlassian products such as Jira, Confluence, Assets, and Jira Service Management.
For each product, you can quickly see:
-
Number of licensed users
-
Adoption rate across the organization
This information helps administrators identify underutilized products and make informed licensing decisions.
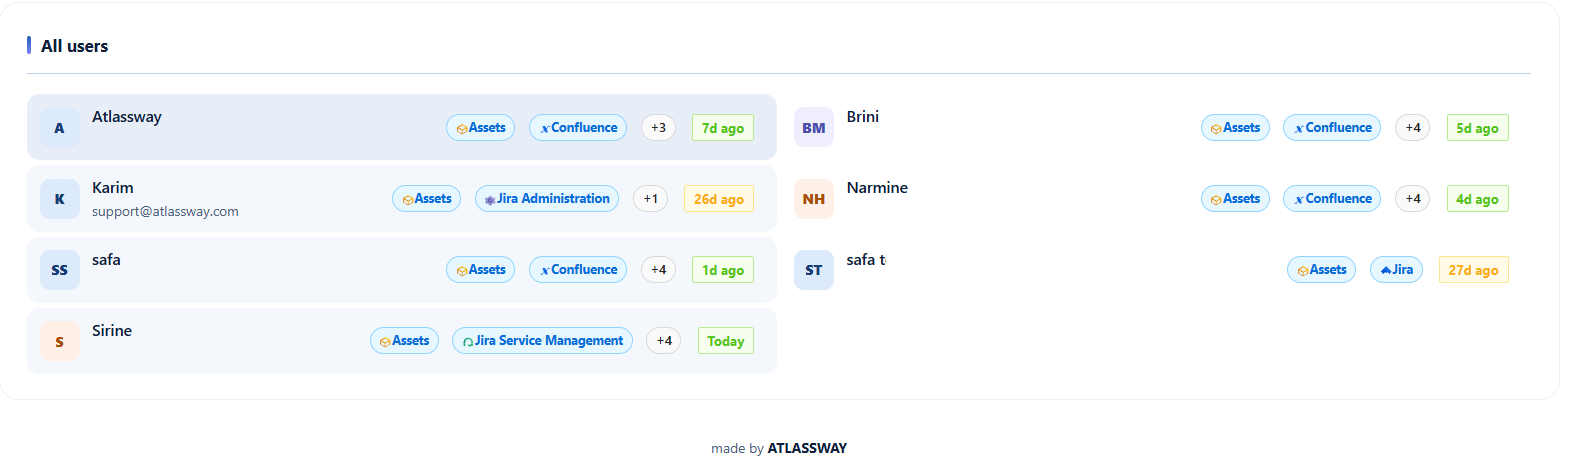
User Activity Overview
The dashboard also provides a consolidated view of all users in the organization.
For each user, you can review:
-
Name and email address
-
Assigned products
-
Last activity date
This allows administrators to quickly identify active users, recently inactive users, and accounts that may require further review.
Users who have never logged in are clearly visible, making it easy to detect unused accounts or pending onboarding activities.
Real-Time Monitoring
To ensure information remains current, the dashboard supports automatic refresh functionality. User activity and license information are continuously updated, providing administrators with the latest view of their organization.
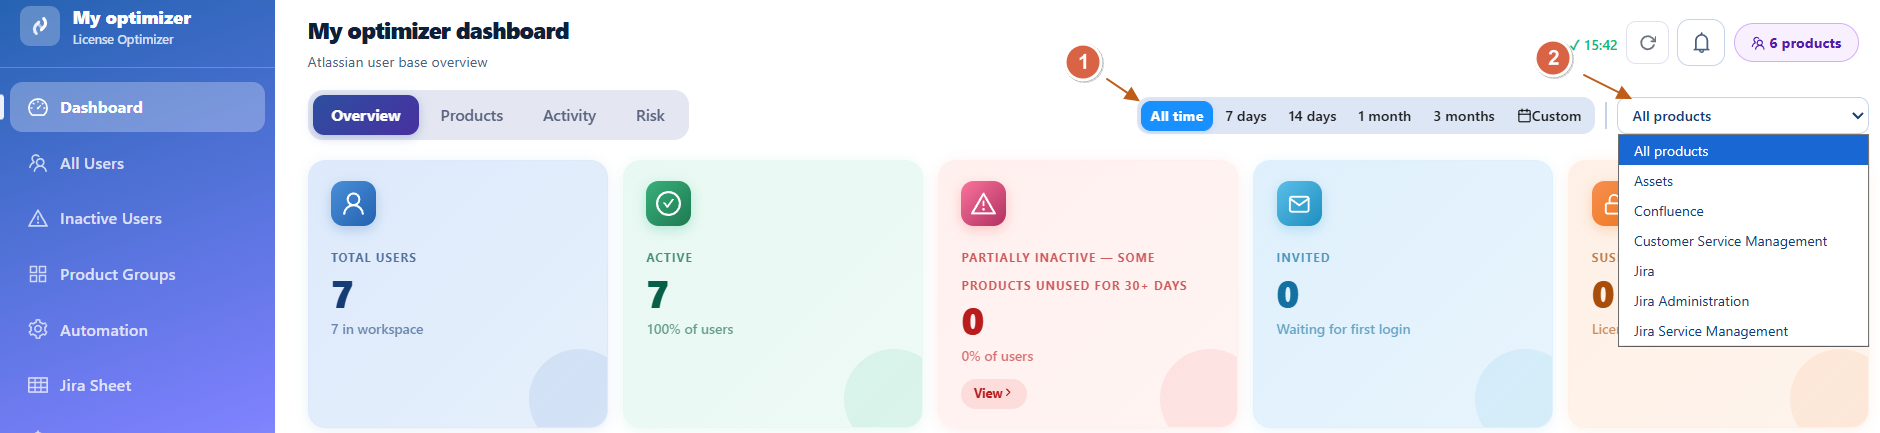
Filter and Analyze Your Data
The dashboard includes powerful filtering options that allow administrators to focus on specific users and time periods.
Activity Period Filter
Use the activity filter to analyze user activity over different time ranges.
Available options include:
-
Last 7 Days
-
Last 14 Days
-
Last month
-
Last 3 months
-
Custom range
Changing the activity period automatically updates all dashboard metrics and user statistics.
Product Filter
Use the product selector to focus on specific Atlassian products.
Available products may include:
-
Jira
-
Confluence
-
Jira Service Management
-
Jira Administration
-
Assets
-
Customer Service Management
Benefits
Using the Dashboard, administrators can:
-
Monitor organization-wide user activity
-
Track license consumption across products
-
Identify inactive or underutilized accounts
-
Detect unused product access
-
Review pending user invitations
-
Make data-driven license optimization decisions
Conclusion
The User & License Insights Dashboard serves as the command center of License Optimizer. By bringing together user activity, license allocation, and product adoption metrics in a single view, it enables administrators to efficiently manage their Atlassian environment and maximize the value of their licenses.
Need help?
💡 We're here for you! If you have questions or need to report a bug, visit our Help Center and raise a support ticket. Our team is ready to assist you!