
The Colored Time In Status gadget allows you to monitor, filter, and highlight key report types directly in your Jira dashboard.
It’s designed to give teams quick access to time tracking, transitions , assignee performance, and other report all in one place.
With powerful filters, highlighting rules, auto-refresh, and export options, this gadget turns your dashboard into a reporting hub for clarity and decision-making.
Adding the Gadget
Start by placing the gadget on your Jira dashboard so you can begin working with reports.
-
Navigate to your Dashboard.
-
Click Edit (top-right).
-
Select Add a Gadget.
-
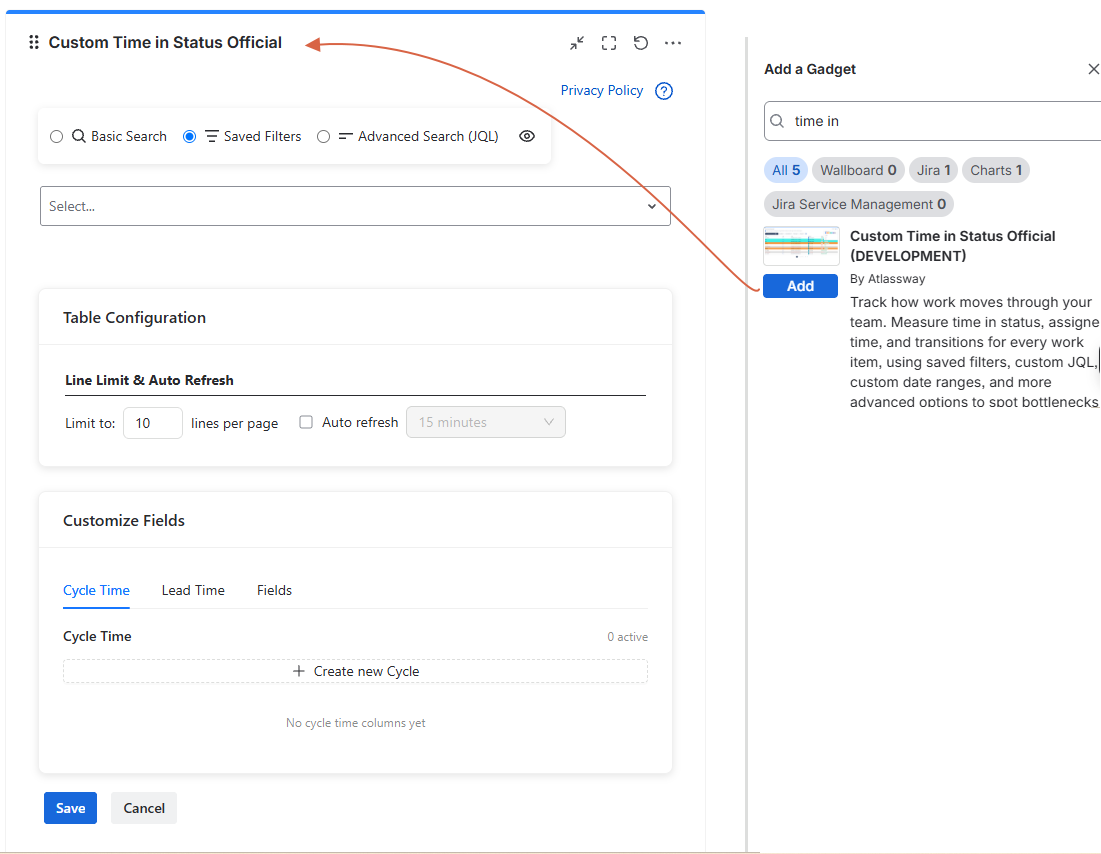
Search for Colored Time In Status in the gadget directory.
-
Click Add to place it on your dashboard.
Configuration Fields
Once added, configure the gadget to display the exact reports you want to track.
Search & Filtering Options
Choose how you want to filter and display report data.
-
Advanced Search (JQL): Write precise queries.
-
Basic Search: Use quick filtering fields.
-
Saved Filters: Reuse Jira filters you already created.
Table Configuration
Control how reports are displayed in your gadget.
-
Line Limit: Decide how many lines to show at once.
-
Auto Refresh: Keep reports updated automatically.
Filters and Actions
Fine-tune your reports with filters and manage them with quick actions.
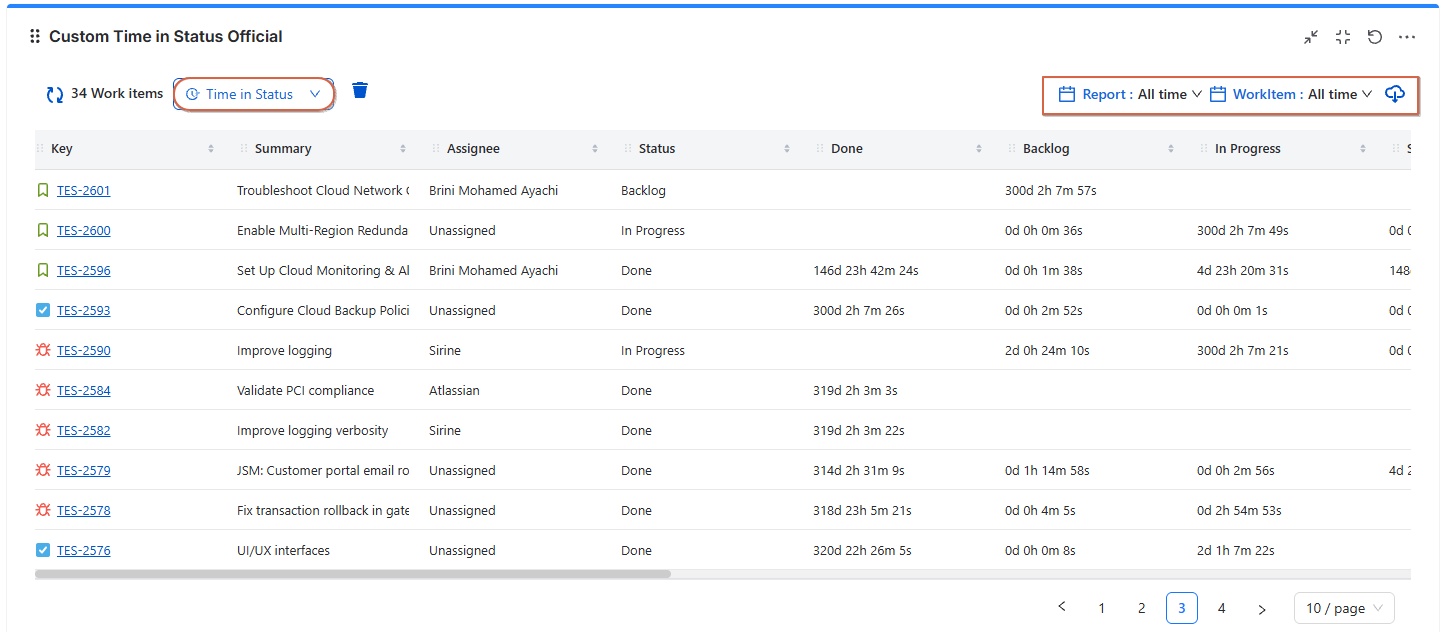
Available Filters
-
Report Type: Show only specific reports.
-
Report time : filter reports by time
-
Work item time : filter work item by time
Actions
-
Export: Save data as CSV (spreadsheet) or PNG (snapshot).
-
Refresh: Reload to see the latest results.
-
Delete Filter: Remove filters instantly.
Conclusion
The Colored Time In Status gadget is a complete reporting tool that brings clarity to your Jira dashboard. With filters, highlights, and exports, it makes data actionable and easy to share.
Need help?
🤝 We're here for you! If you have any questions, suggestions, or feature requests, feel free to reach out — we typically respond within 4 hours.